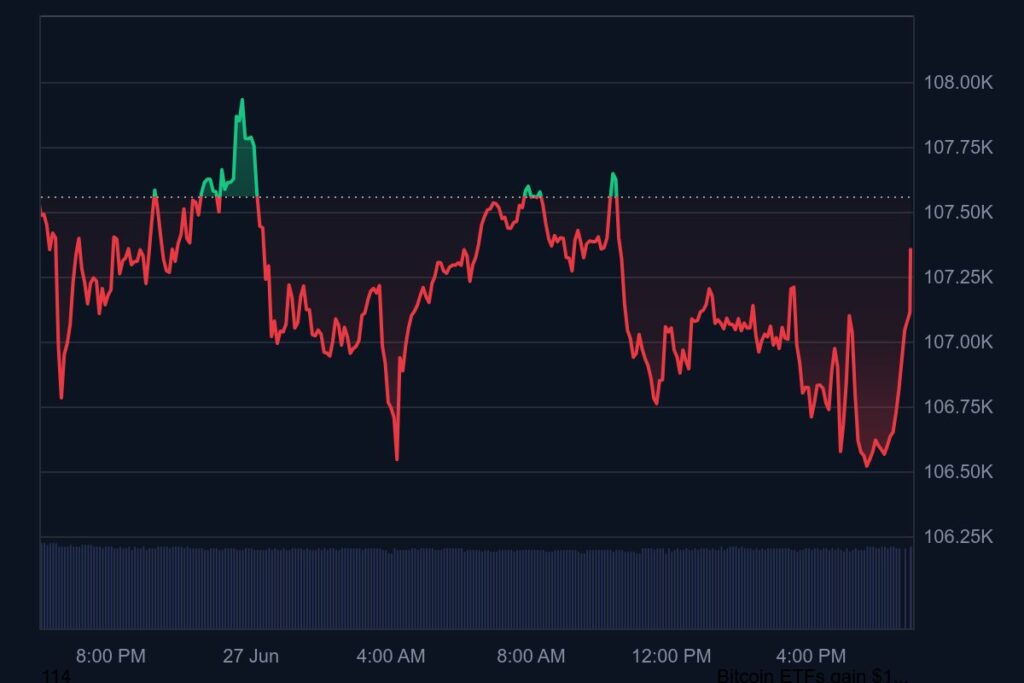
Bitcoin is forming a classic bull flag pattern on its daily chart, suggesting a breakout above $109,000 could trigger a significant rally toward $136,000–$140,000. This technical structure points to bullish momentum and Bitcoin rally resuming after recent consolidation.
What Is a Bull Flag?
A bull flag is a technical continuation pattern marked by a sharp price increase (the “flagpole”) followed by a brief period of sideways or downward consolidation contained within parallel trendlines (the “flag”). This pattern often precedes another leg up in line with the prior rally.
- The pole began with the surge from ~$74K to near $112K.
- The consolidation phase has unfolded between $109K and $100K, holding strong recent lows.

A sustained breakout above the flag’s upper trendline, now around $109,000–$110,000, would validate the pattern and potentially fuel a rally targeting $136K–$140K.
Supporting Indicators
Bitcoin technical analysis helps traders calculate future rises or falls:
Institutional Demand & On‑Chain Activity
- Rising on‑balance volume (OBV) shows accumulation beneath the surface, a classic bullish sign. A similar OBV divergence in April preceded a ~57% rally.
- Exchange outflows of Bitcoin remain high, suggesting long‑term investors are holding or accumulating rather than selling.
Macro & Market Context of Bitcoin Trend
- Bitcoin recently bounced off $99K support, setting a solid base above the $93K–$100K range.
- Favorable macroeconomic signals—such as cooling inflation and optimism around Fed rate cuts—are adding tailwinds.
Price Targets & Key Levels
| Scenario | Trigger | Target Price |
| Bull Flag Breakout | Close above $109K–$110K | $136K–$146K |
| Extended Rally | Continued momentum post-breakout | $140K–$150K+ |
| Lower Flag Reset | Drop below $98K–$99K support | $94K–$95K |
- Breakout above $109K likely unlocks ~$136K target (flag height projection).
- Analysts like Crypto Rover and FXEmpire align with targets in the $136K–$140K range.
- Support levels to monitor are $100K, $98K–$99K, and $93K, marking key risk thresholds.
Risk Insights
- A failed breakout or breakdown below the flag could lead to deeper corrections.
- Ongoing macro volatility—financial markets or geopolitical events—may interrupt technical patterns.
- Monitoring trading volume is vital: a valid breakout should be backed by strong volume momentum.
Why This Matters for Traders
- The bull flag points to a high-probability continuation of the April–May rally.
- Breaking BTC $109K could quickly shift sentiment, prompting broader accumulation across altcoins like Ethereum and Solana.
- Those holding through consolidation have been rewarded; longer-term holders now hold strategic support.
What’s Next?
- Short-term outlook: Watch for a breakout from the bull flag—confirmation may come with a volume-backed close above $109K–$110K.
- Mid-term: A clear break could propel Bitcoin toward $136K–$140K, or even higher if institutional flows strengthen.
- If bearish: Failure to break out could lead to a retest of $98K, where deeper consolidation may occur.
If you want to learn more about the price of BTC today or exchange Bitcoin for USDT and other coins, use SwapGate now.
Traders are advised to track breakout volume and set clear stop-loss levels below recent support. With Bitcoin forming a textbook bullish pattern backed by macro tailwinds, the next few days are pivotal.