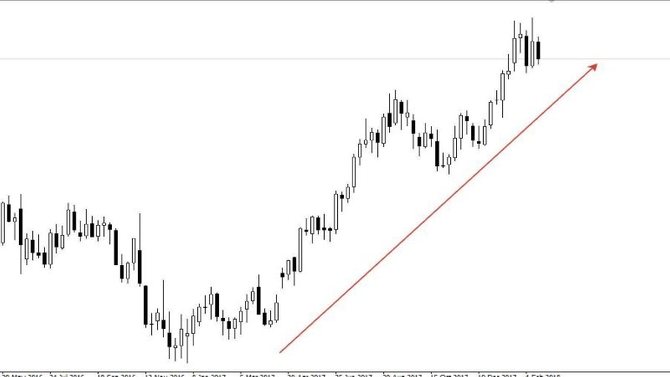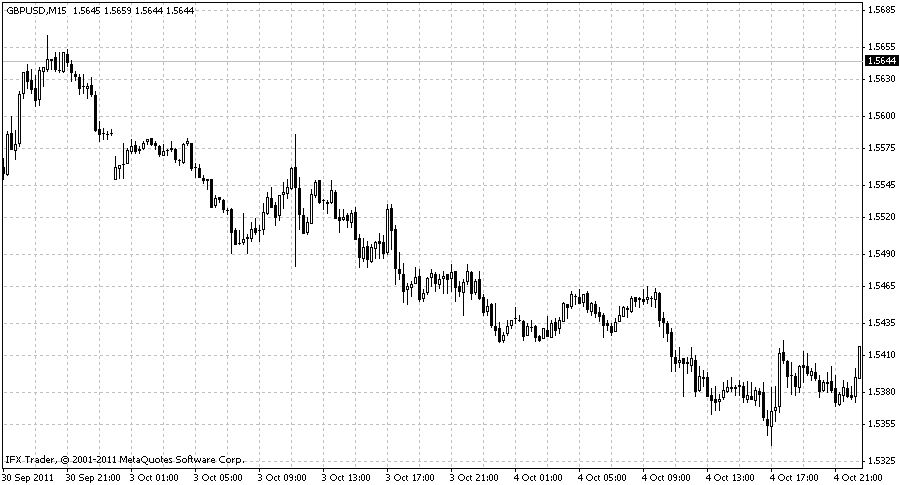
Imagine the market as a battlefield between two animals: a bull and a bear. The bull tries to push prices up with its horns, while the bear tries to pull them down with its paws. When bulls dominate the field, prices rise, and we refer to this as a bullish trend. If the bears are stronger, prices fall, indicating a bearish trend. But how can you determine whether the crypto market is in a bullish or bearish trends? We’ll explore this in the article.
Why Determine Trends?
Understanding the current trend is like having a compass in the sea. It helps us make more informed decisions when investing in cryptocurrencies. If we see that the market is in a bullish trend, we can expect rising prices and plan our purchases accordingly. Conversely, in a bearish trend, it’s wise to be more cautious, possibly locking in profits or protecting investments.
Technical analysis is a market research method based on studying historical price data and trading volumes. Analysts use various tools and indicators to identify recurring patterns and trends to forecast future price movements.
The core idea of technical analysis is that all necessary market information is already reflected in the price. By studying historical data, you can gauge what other market participants are thinking and feeling, and predict how they will act in the future.
Main Tools of Technical Analysis
Charts
Charts are the foundation of technical analysis. They visually display the price changes of an asset over time. There are several types of charts:
- Line Chart: The simplest type, connecting closing price points for each period.
- Candlestick Chart: More informative, showing the opening, closing, high, and low prices for a certain period.
- Bar Chart: Similar to candlesticks, but with vertical lines instead of candle bodies.
Trend Lines
Trend lines are straight lines drawn along consecutive highs or lows that help visually determine the Bullish and Bearish Trends direction.
Support and Resistance Levels
Support and resistance levels are price points where the price historically reverses. A support level is a price below which the price rarely drops, while a resistance level is one the price struggles to rise above.
Indicators
Indicators are mathematical calculations based on historical price and volume data that help confirm or disprove existing trends and signals. Popular indicators include:
- Moving Averages: The average price over a certain period.
- RSI (Relative Strength Index): Measures the speed and change of price movements.
- MACD (Moving Average Convergence Divergence): Identifies the strength of a trend and potential reversals.
- Bollinger Bands: A volatility indicator consisting of three lines: a moving average and two standard deviations from it.
It’s important to remember that technical analysis is a tool to help make more informed decisions, but it doesn’t guarantee profits. Successful trading requires combining technical analysis with fundamental analysis and risk management.
Identifying a Bullish Trend
A bullish trend is a period when asset prices, in our case, cryptocurrencies, are steadily rising. This occurs when demand for the asset exceeds supply, and buyers are willing to pay increasingly higher prices.
Signs of a Bullish Trend
- Continuous price growth: The most obvious sign is the consistent formation of new highs as prices move upward.
- Upward sloping trend lines: Draw a line along consecutive lows, and another along the highs. If both lines slope upward, it signals a bullish trend.
- Formation of rising patterns: Patterns like flags, pennants, and cup-with-handle often signal continued upward movement.
- Indicator behavior:
- RSI above 50: The RSI above 50 indicates that buyers are more active than sellers.
- MACD above the signal line: The MACD above its signal line suggests strong bullish momentum.
- Bollinger Bands: The price is above the middle Bollinger line, and the bands are widening, indicating rising volatility in an upward trend.
- Increased trading volume: Typically, trading volume increases during a bullish trend, especially when breaking through new highs, confirming demand strength.
Example of a Bullish Trend
One of the most notable bullish markets in cryptocurrency history was from late 2017 to early 2018. During this time, prices for Bitcoin and many other altcoins skyrocketed, attracting millions of investors.

There is no universal rule that precisely predicts the beginning and end of a bull market. However, combining these technical indicators and chart patterns can provide strong signals for making informed trading decisions.
Identifying a Bearish Trend
A bearish trend is the opposite of a bullish one. It is a period when asset prices, such as cryptocurrencies, steadily decline. This happens when supply exceeds demand, and sellers must lower prices to find buyers.
Signs of a Bearish Trend
- Continuous price decline: The most obvious sign is the consistent formation of new lows as prices move downward.
- Downward sloping trend lines: If you draw lines along consecutive highs and lows, in a bearish trend, both lines will slope downward.
- Formation of falling patterns: Patterns like head and shoulders or descending triangles often signal continued downward movement.
- Indicator behavior:
- RSI below 50: The RSI below 50 indicates that sellers are more active than buyers.
- MACD below the signal line: The MACD below its signal line suggests strong bearish momentum.
- Bollinger Bands: The price is below the middle Bollinger line, and the bands are widening, indicating rising volatility in a downward trend.
- Increased trading volume during support breakouts: Sometimes, in a bearish trend, trading volume increases, especially when breaking key support levels, confirming the selling strength.
Example of a Bearish Trend
The period of 2018–2019 is considered one of the longest and deepest bear markets in cryptocurrency history. During this time, prices for most cryptocurrencies dropped significantly from their all-time highs.

It’s not always easy to precisely pinpoint the beginning and end of a bearish trend. The market may go through periods of consolidation or temporary rebounds even within a downtrend.
How to Act in a Bearish Trend
- Conservative approach: In a bearish trend, it’s advisable to be cautious and avoid aggressive buying.
- Profit-taking: If you have open positions, it may be wise to lock in some profits.
- Risk management: Use stop losses to limit potential losses.
- Look for new opportunities: A bear market is also a time to study and prepare for the next bull market.
Understanding the differences between bullish and bearish trends is a key skill for any trader or investor in the cryptocurrency market. Combining technical analysis with fundamental analysis and common sense will help you make more informed decisions and increase your chances of success.
Tips for Beginners
- Start with a demo account. Open a demo account on an exchange to hone your skills without the risk of losing real money.
- Learn new tools and strategies. The crypto market is constantly evolving, and you must continuously learn and adapt.
- Join a trading community. Interact with other traders, share experiences, and learn new strategies.
- Be patient. Success in trading doesn’t come instantly. Don’t be afraid to make mistakes and learn from them.
Conclusion
Understanding bullish and bearish trends is the first step toward successful cryptocurrency trading. However, it’s just one of many aspects you need to learn. Continue developing and improving, and you will achieve your financial goals.
The information in this article is for educational purposes only and is not financial advice. It is recommended to consult a financial expert before making any investment decisions.