
SUI trades around the $2 mark, ranking in the top 20 by market cap with several billion dollars in circulating value and a max supply of 10B. Check a live dashboard for the latest SUI price prediction, market cap, and circulating supply details (they move constantly during the day).
Historical Price Trends of SUI
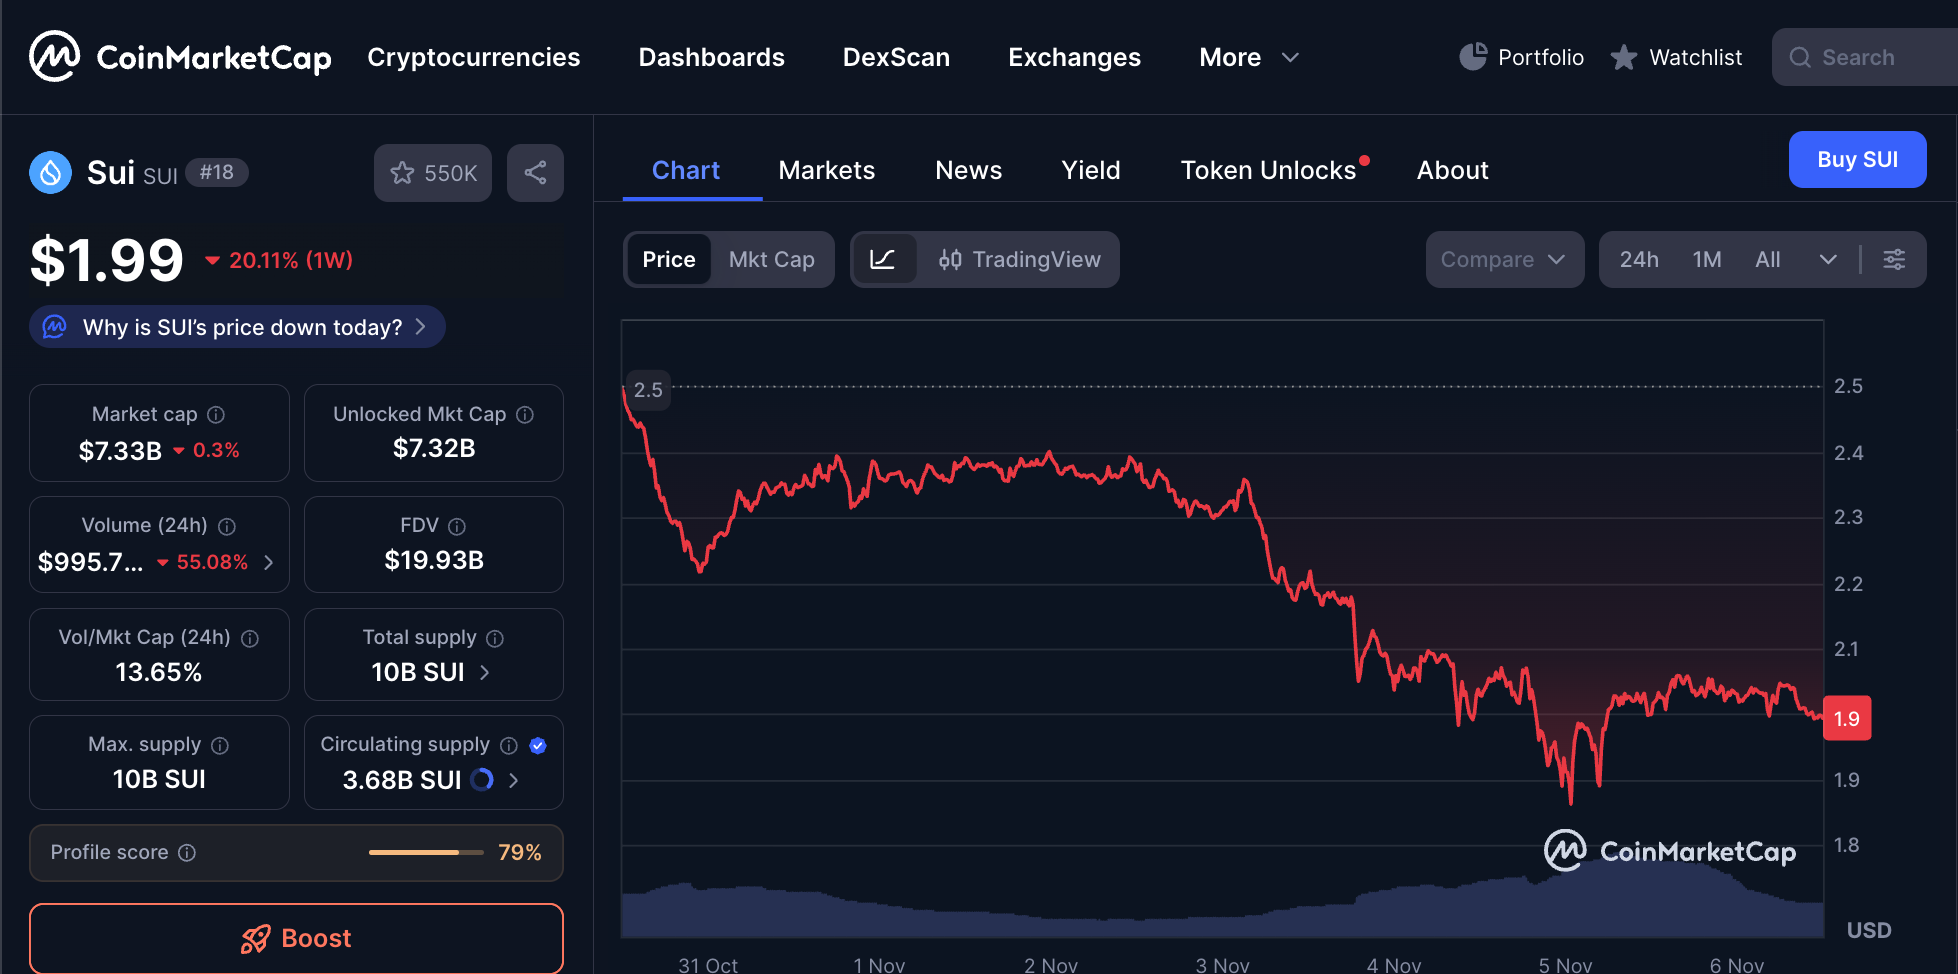
Source: CoinMarketCap
SUI’s all-time high (ATH) was ~$5.35 on Jan 6, 2025 before retracing with broader altcoin volatility. That ATH is a helpful anchor when thinking about SUI price trends and potential re-tests in bullish scenarios.
Throughout 2025, SUI is moving in tandem with risk appetite—popping on positive headlines and fading during deleveraging phases. For example, an August note documented a sharp dip after failing to break resistance, tied to derivatives positioning and long liquidations.
Key Drivers That Impact SUI Price
Technology & Use Cases
Sui aims for low-latency, parallelized execution and an object-centric data model, positioning itself for DeFi, gaming, and high-frequency apps. These technical choices influence SUI outlook because throughput and UX can attract builders and liquidity. (Good tech doesn’t guarantee price, but it enables adoption.)
Adoption & Demand
On-chain fundamentals matter. Messari’s “State of Sui” reports show sustained growth in 2025:
- Average daily DEX volume hit a new ATH of ~$368M in Q2 2025 (+20.8% QoQ).
- Circulating market cap rose ~31% QoQ in Q2, outpacing the broader market.
These data points suggest traction across DeFi venues and users—key inputs for any SUI crypto forecast.
Regulations & Market Trends
Macro and policy still set the weather for altcoins. Market notes repeatedly show how tighter financial conditions or risk-off swings can weigh on will SUI rise-type narratives in the short run—and, conversely, how friendly liquidity and flows can lift boats.
Short-Term SUI Forecast (2025–2026)
Let’s separate what reputable sources publish from internet hype. You’ll notice top research firms and major newsrooms rarely print hard number targets. Where actual numbers are published, they’re usually labeled as tools or opinions:
- Messari: provides fundamentals (volumes, TVL, fees) to frame the narrative—not price targets. Use these to sanity-check any SUI forecast you see.
- Kraken: a simple calculator that outputs sample paths (e.g., with a 5% annual change, it shows ~$3.00 in 2026 and ~$3.65 in 2030). It’s an input-driven tool, not a house forecast.
- CoinCodex: algorithmic ranges put 2025 roughly between ~$1.42 and ~$2.04, and 2030 between ~$2.39 and ~$4.12. Treat these as model outputs—useful for guardrails, not gospel.
- Exchange blogs (e.g., Bitget Academy; some exchanges post “house views”): they summarize ATH context and drivers and sometimes sketch scenario bands (e.g., SUI in the $2–$3 area when conditions stabilize). These are opinions, not audited research.
These ranges sit broadly within tool/opinion bands while grounding the SUI future prediction in on-chain momentum.
Long-Term SUI Forecast (2027–2030)
Long-dated numbers carry even more uncertainty—but here’s how credible sources can help you frame the SUI outlook:
- Kraken’s simple path (again, a user-input calculator) shows ~$3.65 by 2030 at a steady 5% annual change—handy as a conservative baseline if you distrust bolder calls.
- CoinCodex’s model sketches 2030 around $2.39–$4.12—roughly similar to a modest compounding path, implying network execution matters more than quick speculation by that horizon.
Scenario framing for 2027–2030:
- Execution-led growth: If Sui keeps compounding TVL, fees, and DEX share (Messari metrics) and lands sticky use cases (games, consumer apps), a drift toward the upper single-digit billions in TVL could justify upper-range outcomes from the tools above.
- Middle path: Mixed cycles, steady but not explosive usage → track roughly with the Kraken tool-style glide path (low-single-digit yearly appreciation).
- Disruption risk: If liquidity migrates elsewhere or incentives fade, models skew to their lower bands.
Expert Opinions on SUI Price
- Messari analysts: emphasize fundamentals (DEX volumes, market cap growth, fees) rather than price; their Q2 report highlights improving usage, which supports a constructive Sui price trends narrative.
- Kraken Learn: explains why Sui’s architecture could support real use (parallelization, object model)—useful context when asking will SUI rise beyond hype cycles.
- Binance Research: details token utility (fees, staking/delegation), helpful when evaluating long-term value capture in any SUI outlook.
How to Buy or Swap SUI Easily
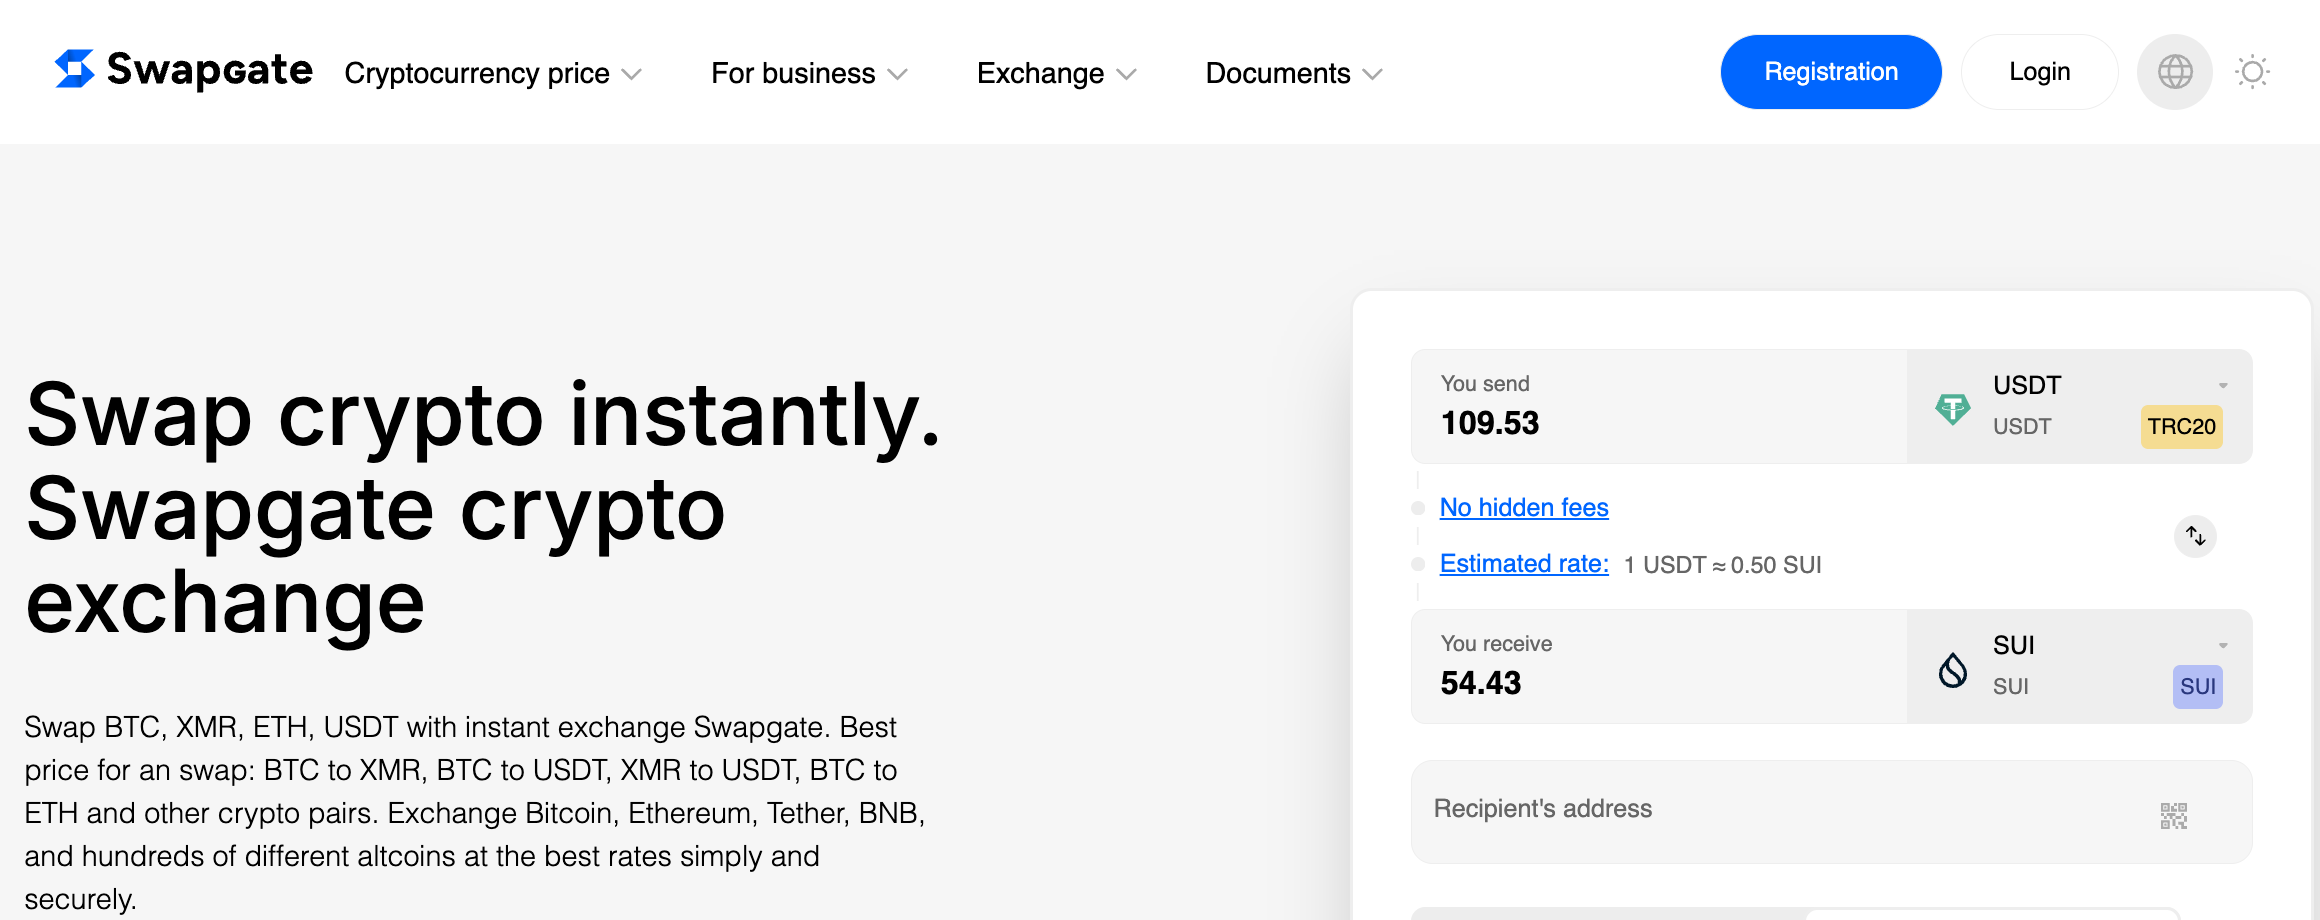
If you want a quick swap (e.g., BTC → USDT), Swapgate offers a streamlined flow with floating or fixed rates and a no-account, no-KYC checkout. Here’s the gist:
- Open Swapgate.io and pick your pair (e.g., USDT → SUI). The widget lets you choose Floating (tracks the market) or Fixed (locks the output for a short window).
- Paste your receiving SUI address and verify the network.
- Create the order and send your deposit to the address shown. Fixed quotes have a countdown; floating quotes can change until funds arrive.
- Receive SUI in your wallet once confirmations clear—typically minutes in normal conditions (timing varies with network load).
- Want to confirm SUI support? Swapgate lists SUI swap pages (e.g., MAJOR→SUI, SUI→other coins), indicating current route availability.
Conclusion: What’s Next for SUI?
The most credible SUI price forecast isn’t a single number; it’s a range tied to drivers. Here’s the sober bottom line:
- Today: SUI sits near ~$2, with a large max supply and active trading. Anchor your SUI future prediction in live market data.
- Near term (2025–2026): If 2025’s on-chain strength (DEX volumes, rising market cap) persists and crypto stays constructive, a base-to-bull path back toward the mid-$2s to low-$4s is possible; choppier macro could compress that to low-$2s or below. Use reputable tools and model ranges only as scenario guides.
- Longer term (2027–2030): Execution and sticky usage matter more than quick headlines. If Sui keeps shipping and compounding adoption, modest compounding paths (à la Kraken’s calculator) and the upper end of algorithmic ranges become plausible; if not, prepare for lower-band outcomes.
Above all: track fundamentals (volumes, TVL, fees), liquidity (listings and depth), and tech progress (what’s shipping and who’s building). That’s how you turn a noisy SUI outlook into a practical plan.