

Key Takeaways:
- What is Bitcoin Dominance? It’s the percentage of the total cryptocurrency market cap that is made up of Bitcoin.
- Why does it matter? It helps traders gauge market sentiment. High dominance often means a focus on Bitcoin; falling dominance usually signals an “altcoin season.”
- How to use it: Watch the BTC dominance chart alongside Bitcoin’s price to spot trends. For example, if BTC price is stable but dominance drops, altcoins are likely surging.
- Key Takeaway: The Bitcoin dominance index isn’t a crystal ball, but it’s a vital tool for deciding whether to hold BTC, trade altcoins, or move to stablecoins.
The King of Crypto
If you’ve spent any time in the cryptocurrency markets, you’ve likely noticed a distinct rhythm. Sometimes, the entire market seems hyper-focused on one asset: Bitcoin. At other times, it feels like every smaller, obscure coin is launching to the moon while the market leader sits still.
This ebb and flow isn’t random. It’s a dynamic cycle that experienced traders track obsessively. At the heart of this cycle is a single, crucial metric that can make or break your trading strategy: Bitcoin dominance.
Understanding what is Bitcoin dominance is essential, especially if you trade altcoins (any cryptocurrency that isn’t Bitcoin). It’s the compass that helps you navigate the turbulent waters of the crypto market, telling you when it might be safe to take on more risk with altcoins and when it’s wiser to retreat to the relative safety of the market leader.
This guide will break down the Bitcoin market dominance, explain how to read the BTC dominance chart, and show you how to use this metric to improve your altcoin trading strategy.
Demystifying Bitcoin Dominance
Before we can use it to trade, we need a clear definition. What exactly are we looking at when we check the Bitcoin dominance percentage?
What is Bitcoin Dominance?
In the simplest terms, Bitcoin dominance is the ratio of Bitcoin’s market capitalization to the total market capitalization of all cryptocurrencies combined.
Think of the entire cryptocurrency market as a massive pie. The Bitcoin dominance index tells you exactly how large Bitcoin’s slice of that pie is.
The Formula
The calculation is straightforward:
Bitcoin Dominance = (Bitcoin Market Cap / Total Crypto Market Cap) × 100%
- Bitcoin Market Cap: The current price of one Bitcoin multiplied by the total number of Bitcoins in circulation.
- Total Crypto Market Cap: The combined market capitalization of Bitcoin, Ethereum, Solana, and every other tracked cryptocurrency.
A Brief History of BTC Dominance
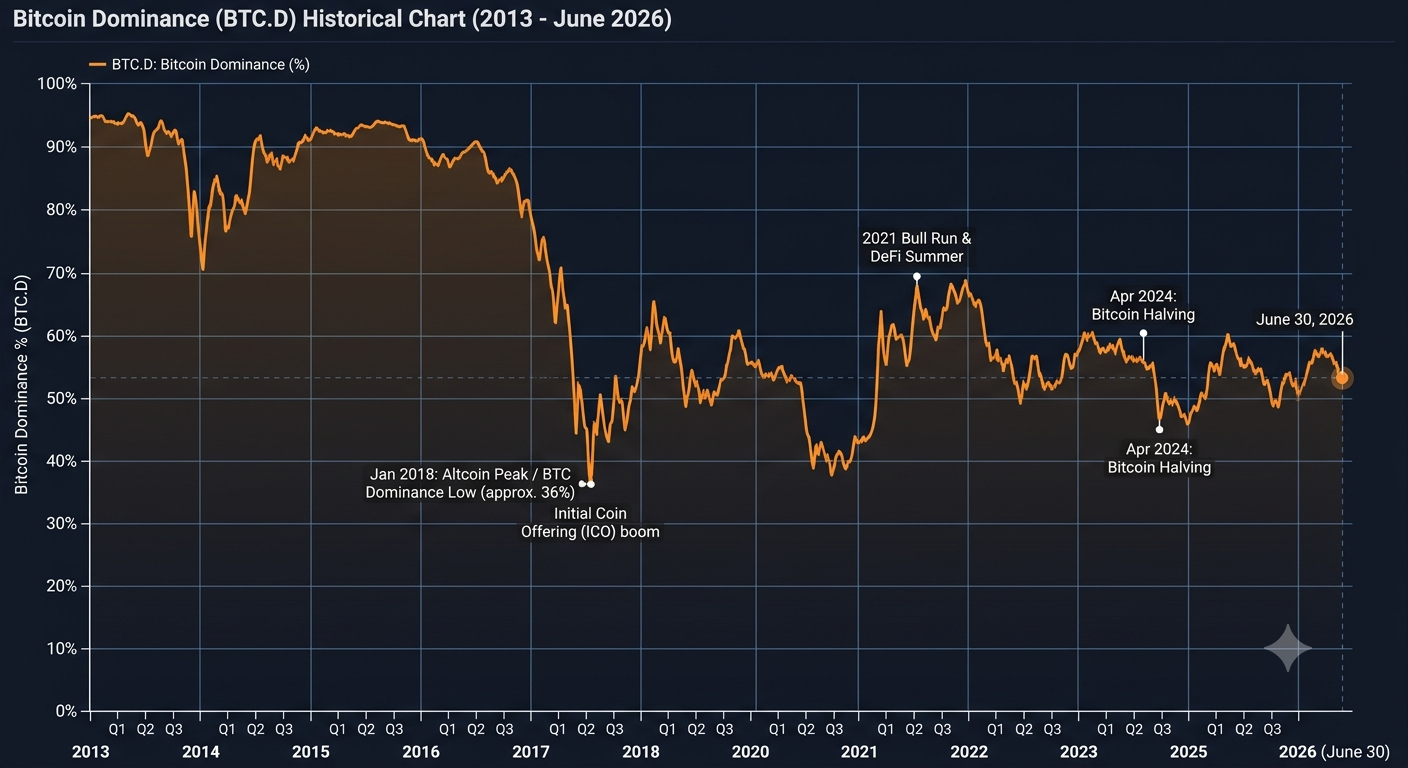
To understand the current Bitcoin dominance percentage, it helps to look at where it came from.
- The Early Days (Pre-2017): For the first several years of its existence, BTC market dominance hovered near 100%. Bitcoin was the crypto market. There were very few altcoins, and none held significant value.
- The 2017 ICO Boom: This was the first major turning point. The Initial Coin Offering (ICO) craze saw thousands of new tokens flood the market, primarily built on Ethereum. As billions of dollars flowed into these new projects, the Bitcoin dominance percentage plummeted, hitting lows around 35% in early 2018.
- The Bear Market Rebound (2018-2019): During the subsequent “crypto winter,” many altcoins lost 90-99% of their value. Investors fled back to the perceived safety of Bitcoin, driving dominance back up above 70%.
- The 2021 Bull Run and Beyond: The rise of DeFi (Decentralized Finance) and NFTs (Non-Fungible Tokens) sparked another massive altcoin season, sending dominance back down. Today, it fluctuates based on market cycles, institutional adoption, and macroeconomic factors.
Why Altcoin Traders MUST Care
You might be thinking, “I only trade low-cap altcoins on decentralized exchanges. Why should I care about the BTC dominance chart?”
The answer lies in the fundamental relationship between Bitcoin and the rest of the market. Bitcoin is the reserve currency of the crypto ecosystem. Most trading pairs on major exchanges are still denominated in BTC (e.g., ETH/BTC, SOL/BTC). Therefore, what happens to Bitcoin inevitably impacts everything else.
The Dynamics of BTC Dominance vs Altcoins
The relationship between BTC dominance vs altcoins is essentially a measure of risk appetite.
- High/Rising Dominance = Risk-Off: When Bitcoin dominance is increasing, it generally means money is flowing out of altcoins and into Bitcoin. Investors perceive the market as risky or uncertain, so they seek the relative safety of the largest, most established asset. During these periods, altcoins usually suffer, bleeding value against both USD and BTC.
- Low/Falling Dominance = Risk-On (“Altseason”): When the Bitcoin dominance percentage is falling, it signals that money is flowing out of Bitcoin and into altcoins. Investors are feeling confident and greedy, willing to take on higher risk for the chance of exponentially higher returns. This is when altcoins see their most explosive growth.
The Four Market Scenarios
To effectively trade, you can’t just look at dominance in isolation. You must combine the BTC dominance index with the price action of Bitcoin itself. This creates four primary market scenarios:
| Bitcoin Price | Bitcoin Dominance | What it Means for Altcoins | Trader Action |
| Rising | Rising | Altcoins are dropping in BTC value, but might hold USD value. Money is rushing into BTC. | Buy/Hold Bitcoin. Avoid aggressive altcoin positions. |
| Rising | Falling | The Holy Grail (Altseason). Money is flowing into crypto, but faster into altcoins. Both BTC and altcoins rise in USD value, but altcoins outperform. | Aggressively trade/hold strong altcoins. |
| Falling | Rising | Altcoins are getting crushed. Money is leaving the crypto market entirely, but leaving altcoins faster than BTC. | Move to stablecoins or short the market. Protect capital. |
| Falling | Falling | Rare. Altcoins might be holding up better than BTC temporarily, but overall market sentiment is poor. | Exercise caution. Look for relative strength in specific altcoins, but stay defensive. |
How to Read the BTC Dominance Chart
Now that you understand the theory, let’s get practical. How do you actually use the BTC dominance chart in your daily trading?
Where to Find the Chart?
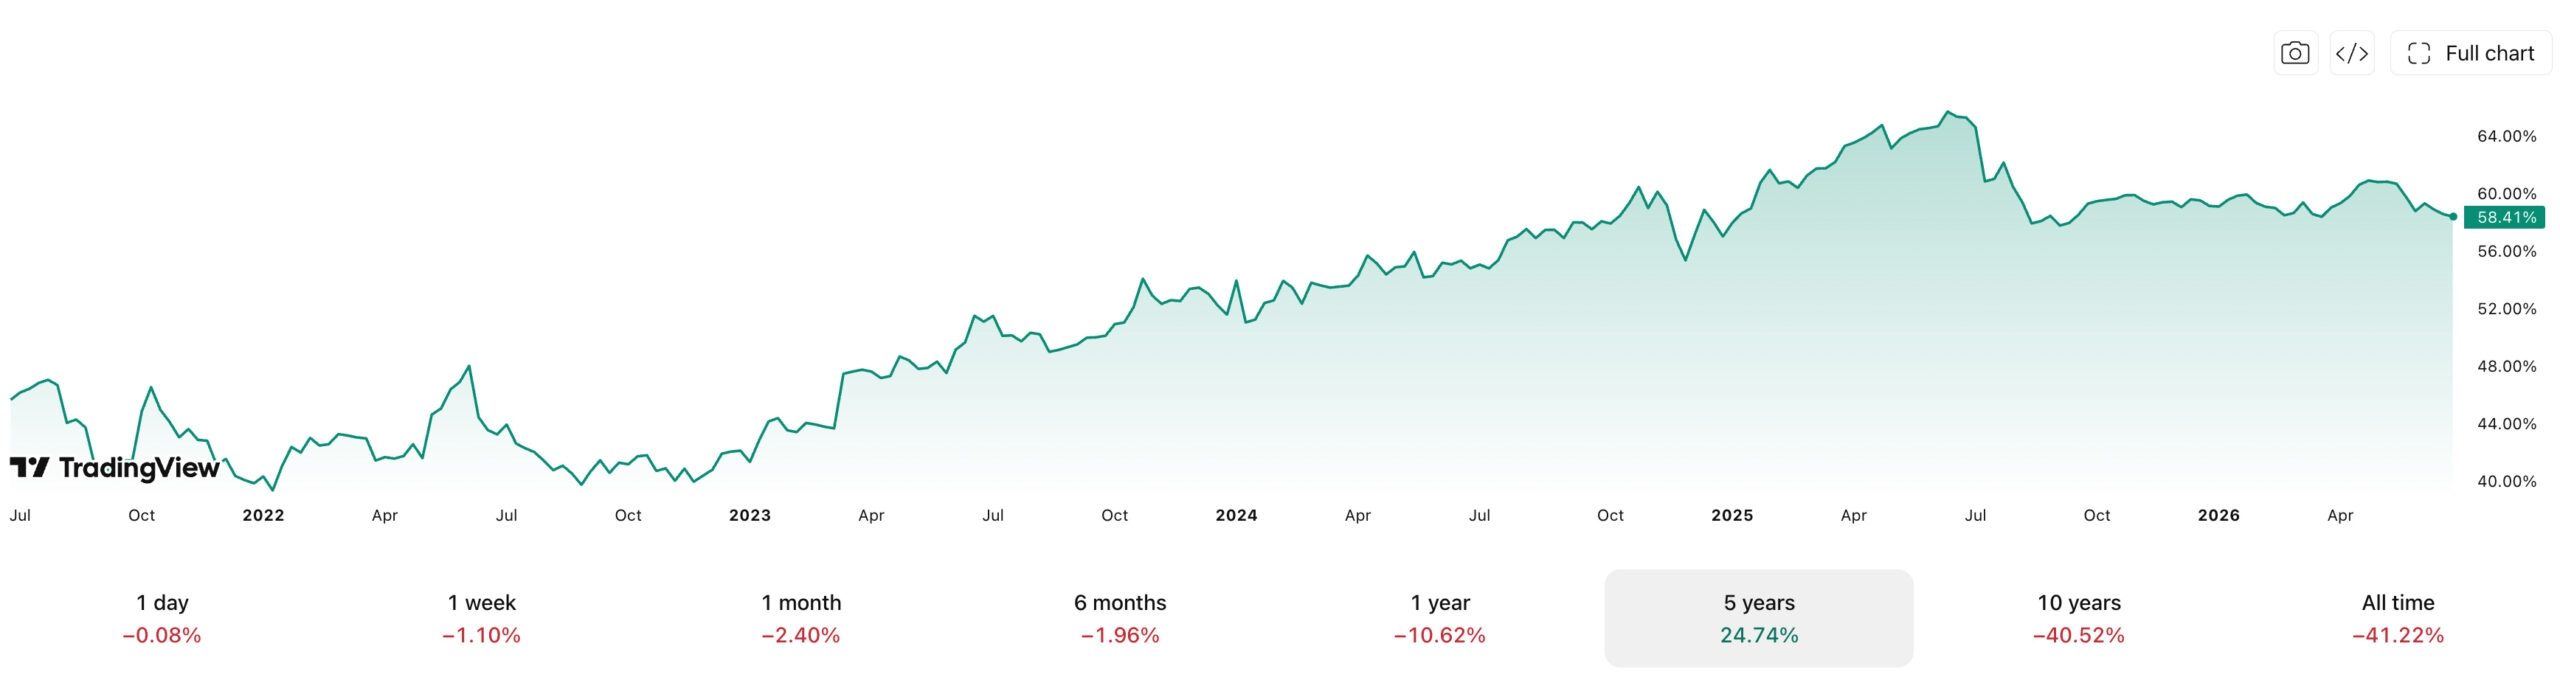
The most common place traders analyze Bitcoin dominance is on TradingView. The ticker symbol you need to search for is BTC.D.
This chart functions just like any other price chart. You can apply moving averages, draw trendlines, and use indicators like the RSI (Relative Strength Index) or MACD (Moving Average Convergence Divergence) to analyze its movements.
Key Technical Analysis Concepts for BTC.D
Analyzing the BTC dominance chart isn’t about predicting a price; it’s about predicting capital flow.
- Support and Resistance: Just like a stock price, the Bitcoin dominance index finds levels where it tends to bounce (support) or get rejected (resistance). For example, historically, the 39-40% range has been a massive support level. If dominance approaches this level, it’s often a signal that an altseason might be ending, and capital will rotate back to Bitcoin.
- Trendlines: Is dominance in an established uptrend or downtrend? A break of a long-term trendline can signal a major shift in market sentiment.
- Moving Averages: Many traders watch the 50-day and 200-day moving averages on the BTC.D chart. A “Death Cross” (50-day crossing below the 200-day) on dominance could signal a prolonged altcoin season.
The Altcoin Season Index
While tracking Bitcoin market dominance is crucial, many traders also use complementary tools. One popular tool is the “Altcoin Season Index” (available on sites like Blockchain Center).
This index tracks the performance of the top 50 altcoins relative to Bitcoin over a 90-day period. If 75% of those altcoins outperform Bitcoin, it’s officially “Altcoin Season.” While this is a lagging indicator, it confirms the trends you might spot early on the BTC dominance chart.
Building a Trading Strategy Around Dominance
Understanding what is Bitcoin dominance is only half the battle. The real skill lies in translating that knowledge into profitable trades. Here are actionable strategies based on the Bitcoin dominance percentage.
Strategy 1: The Capital Rotation Play
This is the most fundamental strategy for crypto traders. It relies on the cyclical nature of the market.
- Phase 1: Bitcoin Run. The market wakes up. New money enters, almost exclusively buying Bitcoin. BTC price rises, and Bitcoin dominance rises. Action: Hold Bitcoin.
- Phase 2: Consolidation. Bitcoin reaches a new high and begins to trade sideways. The BTC dominance chart hits resistance and starts to roll over. Profits from the Bitcoin run start looking for higher yields.
- Phase 3: Large Cap Altseason. Money flows from Bitcoin into major altcoins (Ethereum, Solana, etc.). BTC dominance drops steadily. Action: Rotate profits from BTC into large-cap altcoins.
- Phase 4: Small Cap Mania. The final, most explosive phase. Money flows from large caps into mid, small, and micro-cap altcoins. The Bitcoin dominance index plummets to its lowest levels. Action: Take profits aggressively on small caps; prepare for the cycle to end.
- Phase 5: The Correction. The market runs out of steam. Everything crashes, but altcoins crash harder. Bitcoin market dominance spikes upward rapidly as investors flee to safety. Action: Move to stablecoins; wait to buy Bitcoin at lower prices.
Strategy 2: Hedging with Dominance
If you are a long-term holder of altcoins but you see the current Bitcoin dominance percentage breaking out of a long downtrend and starting to rise, you need to protect your portfolio.
Instead of selling all your carefully researched altcoins (incurring tax events and fees), you can hedge. If dominance is rising, it means altcoins are likely bleeding against BTC. You could short a basket of weak altcoins or short specific altcoin/BTC pairs while keeping your long-term USD positions open.
Strategy 3: Spotting Divergences
Sometimes, the BTC dominance chart tells a different story than the price chart, offering early warning signs.
- Bearish Divergence for Altcoins: Imagine Bitcoin’s price is slowly grinding upward, making new local highs. However, you notice that Bitcoin dominance is also rising sharply. This means that only Bitcoin is rising. The broader market is weak. This is a fragile rally, and altcoins are vulnerable to a steep drop if Bitcoin corrects.
- Bullish Divergence for Altcoins: Bitcoin’s price is falling slightly or consolidating, but the Bitcoin dominance percentage is dropping fast. This means that despite Bitcoin’s weakness, buyers are aggressively accumulating altcoins. This often precedes a major altcoin breakout.
The Nuances and Limitations of Bitcoin Dominance
No indicator is perfect, and relying solely on the Bitcoin dominance index can be dangerous if you don’t understand its limitations. The crypto market of today is vastly different from the market of 2017, and the metric has evolved.
The Stablecoin Problem
The biggest flaw in the traditional calculation of Bitcoin market dominance is the inclusion of stablecoins (like USDT, USDC, DAI).
Stablecoins are pegged to fiat currencies and don’t fluctuate in value like traditional cryptocurrencies. Their market cap grows when people mint new coins (often putting fiat into the system) and shrinks when people redeem them.
During a severe bear market, people sell their Bitcoin and altcoins for stablecoins. The total crypto market cap shrinks, but the stablecoin market cap stays the same or grows. This artificially inflates the market share of stablecoins and, consequently, slightly distorts the Bitcoin dominance percentage.
Many professional traders prefer to use a modified dominance chart that excludes stablecoins to get a purer view of risk appetite between BTC and altcoins. (You can create this on TradingView using custom formulas, e.g., BTC.D / (100 – USDT.D – USDC.D)).
The Ethereum Factor
In the early days, “altcoins” were a monolithic group of small, highly speculative projects. Today, Ethereum (ETH) is a behemoth. It has its own massive ecosystem, institutional adoption, and a market cap that dwarfs the rest of the altcoin market.
Because Ethereum is so large, a significant portion of the movement in the BTC dominance chart is actually just a reflection of the ETH/BTC trading pair. If Ethereum has a major upgrade and surges against Bitcoin, Bitcoin dominance will fall, even if smaller altcoins aren’t moving at all.
Therefore, when analyzing BTC dominance vs altcoins, it’s crucial to also look at Ethereum dominance (ETH.D) and the specific altcoin charts you intend to trade.
It’s a Relative Metric, Not Absolute

Remember that Bitcoin dominance is a ratio. It can change even if Bitcoin’s price doesn’t move a single cent.
If Bitcoin’s market cap stays exactly at $1 trillion, but the total altcoin market cap doubles from $500 billion to $1 trillion, the current Bitcoin dominance percentage will drop from 66% to 50%. This metric tells you where the money is relative to other assets, not necessarily if the total amount of money in the system is growing or shrinking.
Conclusion: Making Dominance Work for You
Trading cryptocurrencies is an exercise in managing probabilities. There are no guarantees, only indicators that suggest one outcome is more likely than another.
The Bitcoin dominance index is one of the most powerful probability indicators available to crypto traders. It provides a macro view of market sentiment, helping you answer the most critical question in crypto: Are we in a risk-on or risk-off environment?
By understanding what is Bitcoin dominance, tracking the BTC dominance chart, and combining that information with Bitcoin’s price action, you can dramatically improve your market timing. You’ll know when to hold the king of crypto, and when to venture out into the wild west of altcoins for those life-changing gains.
Don’t let the noise of the market overwhelm you. Keep a close eye on the Bitcoin market dominance, and let the flow of capital guide your trading strategy.
Frequently Asked Questions (FAQ)
What is a good Bitcoin dominance percentage?
There is no single “good” number. A “good” dominance level depends on your strategy. If you are heavily invested in altcoins, a low or falling dominance (e.g., below 45%) is “good.” If you hold mostly Bitcoin, a rising dominance is “good” as it shows BTC is outperforming.
Does Bitcoin dominance include stablecoins?
The standard calculation (like the BTC.D ticker on TradingView) does include stablecoins in the total market cap. However, many advanced traders use customized charts that exclude stablecoins for a clearer picture of capital flow between volatile assets.
Will Bitcoin dominance ever go back to 90%?
It is highly unlikely. The cryptocurrency ecosystem has grown too diverse, with entire sectors (DeFi, Gaming, NFTs, decentralized infrastructure) built on other blockchains like Ethereum and Solana. While dominance will spike during bear markets, the baseline level has permanently shifted lower as the industry matures.
How often should I check the BTC dominance chart?
It depends on your trading style. Day traders might check it on hourly timeframes to spot intraday shifts in sentiment. Swing traders and investors only need to check it daily or weekly to monitor macro trends.
If Bitcoin dominance goes down, do altcoins always go up?
Not necessarily. If the Bitcoin dominance percentage drops and Bitcoin’s price is dropping significantly, it usually means the entire market is crashing, but money is leaving Bitcoin faster than altcoins (often because altcoin liquidity has dried up). For a true “altseason,” you generally want to see dominance falling while Bitcoin’s price is stable or rising slowly.